Author

Global Waste Trade and its Effects on Landfills in Developing Countries
Abstract
Globally, solid waste is generated in the billions of tonnes every year, governments and societies have the burden of adequately managing and disposing of this waste. Some of this waste has been managed by exporting it, particularly in the last 30 years. Flows are largely from developed countries to developing countries that are ill-equipped to manage it. More recently, developing nations have enacted regulation and looked to the UN for assistance to staunch the inflow of waste. This remains a temporary measure to alleviate the stress on solid waste management structures. There does exist a world where global waste trade benefits importing and exporting country equity. To reach this state of equity, governments worldwide will have to work together to ensure systems are not overwhelmed and within their own nations to manage as much solid as possible adequately and sustainably.
Keywords: Global Waste trade, Landfills, Global municipal waste production, Open dumping, global waste trade flow
Introduction
The World Bank estimated that 2.01 billion tonnes of waste were generated globally in 2016. Waste generation is an inevitable consequence of human life that arises from day-to-day consumption. Companies and governments are obliged to encourage consumption to keep the economy and their revenues afloat. Societies, therefore governments, are then left with the mammoth task of managing the solid waste generated as a consequence. This paper specifically looks at the management of solid waste.
Global waste management capacity has been augmented by engaging in waste trade. The global waste trade was worth approximately $98.3 billion from 1988 to 2016 for importing countries. The largest exporter of waste in that period was the EU28 (when considered collectively), while the largest importer was China (including Hong Kong). For a number of years, developing countries were more than willing to take on this excess waste on behalf of their wealthier allies, largely due to economic advantages and regulatory freedoms that allowed them to do so.
As developing countries became overburdened with the management of imported waste on top of the waste generated locally, they put in place regulation to staunch the inflow of waste. China banned imports of most plastic waste in 2018 shifting the balance of trade significantly; estimates suggest that up to 37 million tonnes of plastic waste was displaced by this ban on imports. Eventually, other countries followed suit with a UN accord, giving them more power to decline harmful imports.
Even with this change in trade flow and the emboldening of developing nations, the question remains: what happens to the solid waste generated around the world? There is a world where waste trade is equitable, that is, it benefits both importers and exports i.e., with the right legislative checks and waste management capabilities. This, however, does not take away from the requirement for countries around the world to better manage solid waste in order to create a sustainable environment fit for future generations.
Overview of global waste production and management
An estimated 2.01 billion tonnes of municipal waste were generated globally in 2016. According to the World Bank, waste generation is generally correlated with income levels and urbanisation, not population. This implies that higher income countries generate more waste than developing or lower income countries. For instance, high income countries account for 16% of the world’s population and 34% of its waste while lower income countries account for 9% of population and 5% of waste.
Map 1 – Annual municipal solid waste generation (kg per capita per day)
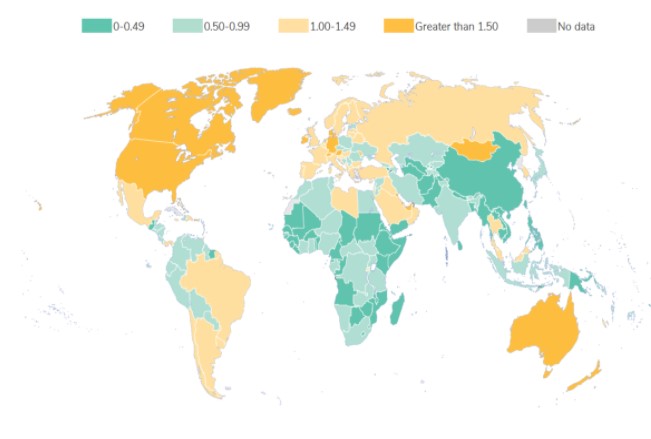
Source: World Bank – What a Waste 2.0: A Global Snapshot of Solid Waste Management to 2050
The solid waste itself is comprised of 44% food and green waste; the next largest category is dry recyclables which account for 38% of municipal waste internationally. It is important to note that as income levels rise, the proportion of plastic waste generated also increases; lower income countries tend to generate more organic waste. In high income countries 56% of waste generated are dry recyclables and 32% food and green waste, while in middle to low income countries the proportion is 34.5% and 53% respectively.
Chart 1 – Waste Composition by Region (%)
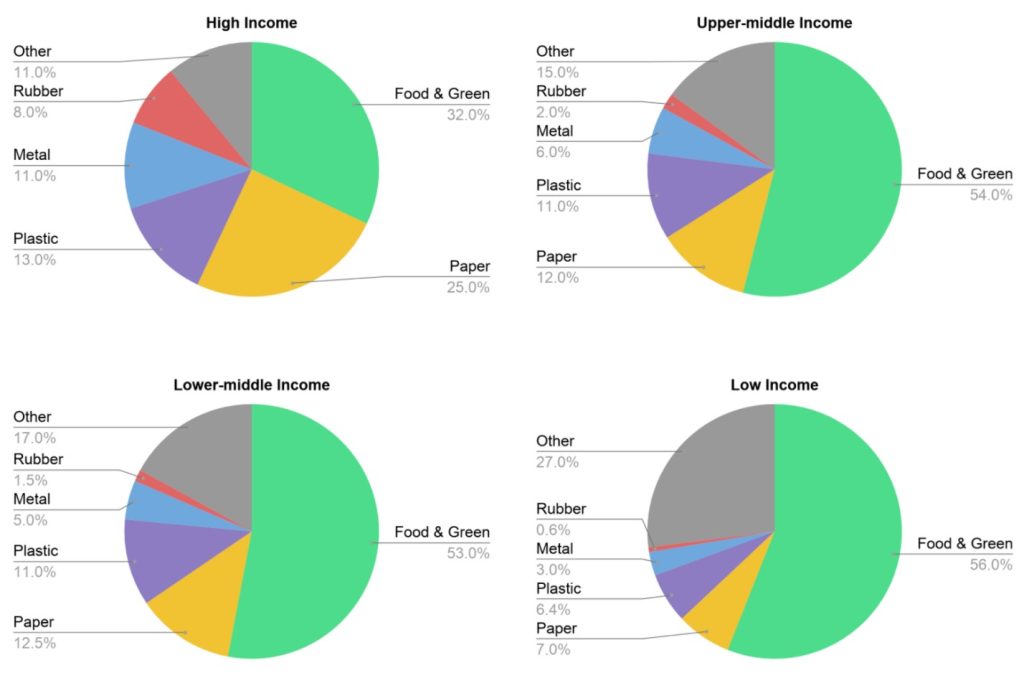
Source: World Bank – What a Waste 2.0: A Global Snapshot of Solid Waste Management to 2050
The production of more dry-recyclable waste could be considered one reason developed nations are more likely to export their waste. It is easy to see why waste trade has become so prevalent if waste production is considered with the legislative hurdles in developed nations which have more robust legal frameworks for managing waste and the economic advantage offered to developing countries by importing solid waste.
Methods of Waste Disposal
A majority (~70%) of solid waste is dumped in a landfill[i]. Developing nations trail developed nations in their capacity to manage waste sustainably, for instance by way of sanitary/controlled landfilling or best yet recycling. As a result, 66% of waste in lower-middle income countries and 93% of waste in low-income countries is dumped openly.
Uncontrolled disposal of solid waste particularly through landfills can cause significant harm to the environment. First, heavy metals pollution through seepage of harmful materials from decomposing waste to ground water and soil. Second, landfills act as breeding grounds for disease that adversely affect workers and waste pickers who depend on landfills. Third, when not adequately planned and managed landfills take up large swathes of land –an increasingly scarce commodity.
The difference in waste management methods can be directly attributed to a difference income levels and stage of development. Developed countries tend to have better infrastructure and stricter regulation for the management and disposal of waste, developing countries have the inverse. Moreover, the latter face the extra burden on their infrastructure and resources that stem from having to manage imported waste on top of locally generated waste.
Chart 2 – Waste Disposal Method by Regional Income Level
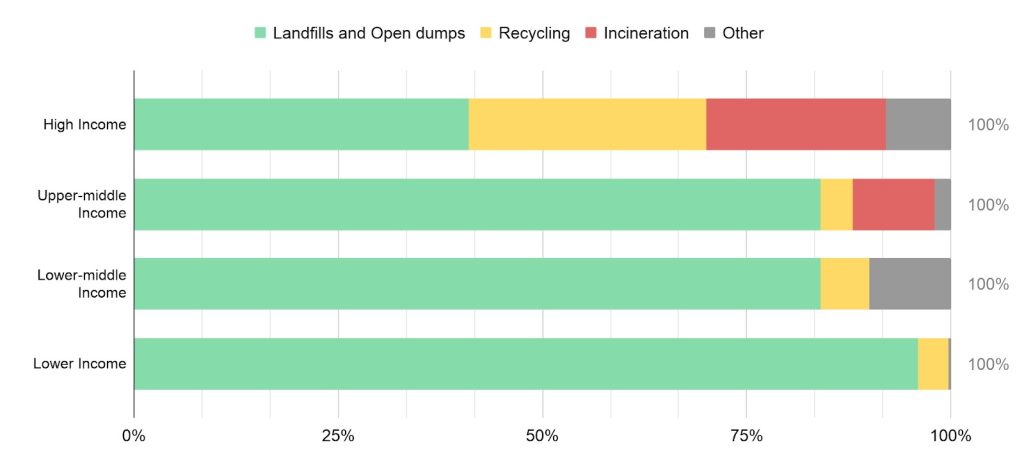
Source: World Bank – What a Waste 2.0: A Global Snapshot of Solid Waste Management to 2050
Chart 3 – Waste Disposal Method by Region
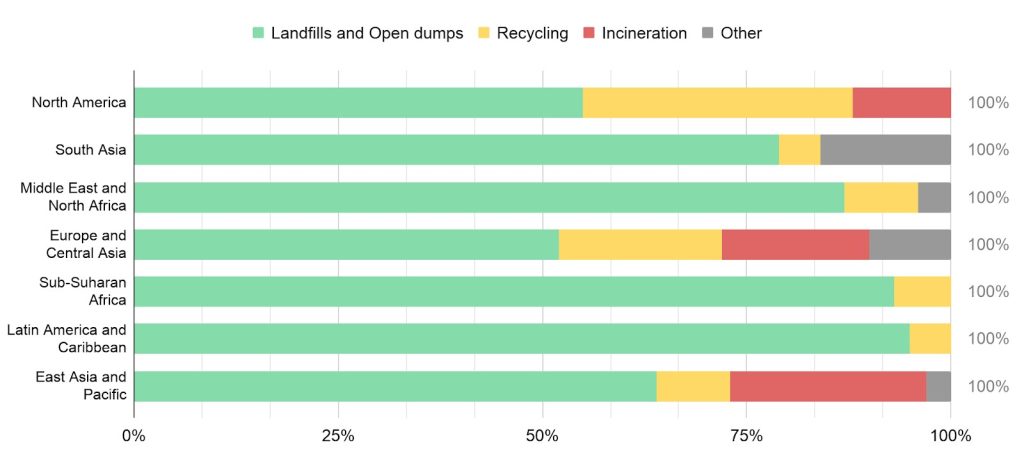
Source: World Bank – What a Waste 2.0: A Global Snapshot of Solid Waste Management to 2050
Global Waste Trade
As an alternative to managing waste in-country, developed nations have tended to export their waste to developing countries across Asia and Africa. The global waste trade was valued at $98.3 billion to importing countries from 1988 to 2016. The flow of trade is predominantly from developed countries in Europe and North America to Asia and Africa. Considering that Hong Kong serves as an entry port to China for imported plastic waste (See Table 1).
Global annual waste trade grew rapidly from 1993 and continued to grow exponentially in 2016. In 1993, waste trade grew by 723% while in 2016 it grew by 817%
Chart 2 – Trade of plastic waste in mass and trade value
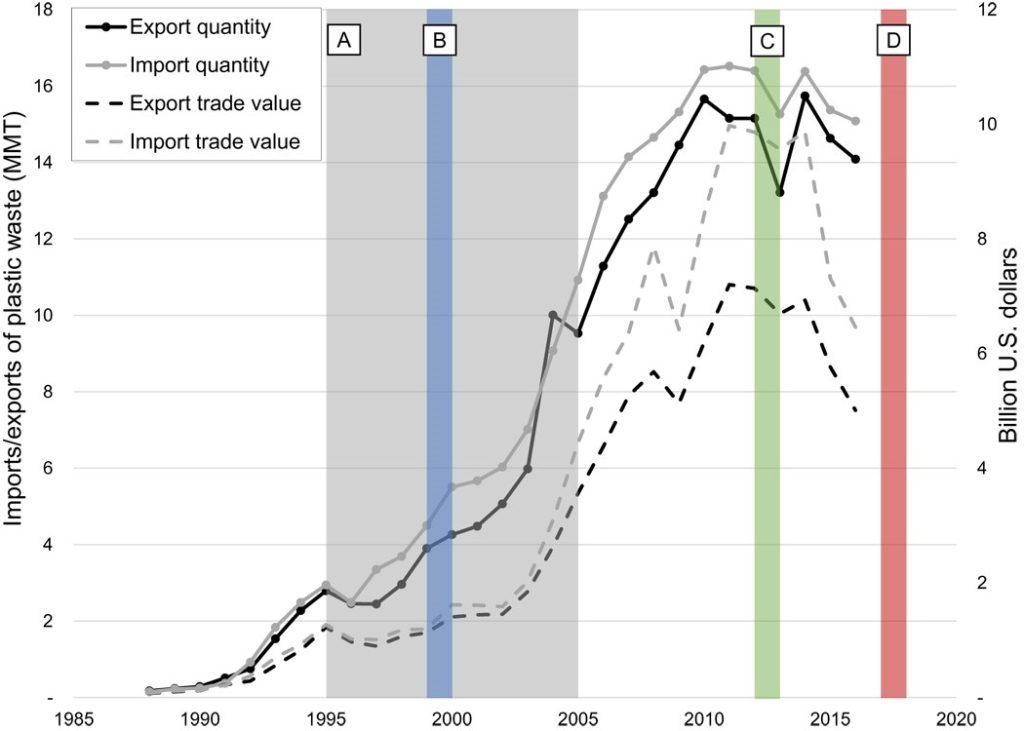
Note: Source: UN Comtrade; Advances in Municipal Recovery Facility (MRF) technology resulting in expansion of commingled recycling, especially single-stream recycling in the United States (1995–2005) (see the Supplementary Materials). (B) Surge in globalization, supported by the World Trade Organization and the International Monetary Fund (29–31). (C) Implementation of temporary Chinese import restrictions (Green Fence) (2013). (D) Implementation of the new Chinese policy banning the import of nonindustrial plastic waste (2017).
Developed countries are driven to export by the relatively higher cost of waste treatment and more stringent regulation on waste management at home. While, importing countries are not beholden to tight regulations and quite importantly benefit economically from accepting sole waste from wealthier nations.
Since the 1990s China had been the largest importer of plastic waste, accounting for 72%[ii] of global plastic imports from 1988 to 2016. While, developed countries did import large amounts of plastic waste during the same period many of these were cases of nations augmenting inputs for their plastic recycling industries. Here the important distinction is that the main driver for importing plastic waste (recycling or reusing) was achieved, while in developing nations this is rarely true
Map 2 – Sources of plastic waste imports into China (2016) and cumulative plastic waste export tonnage (MMT, 1988–2016)
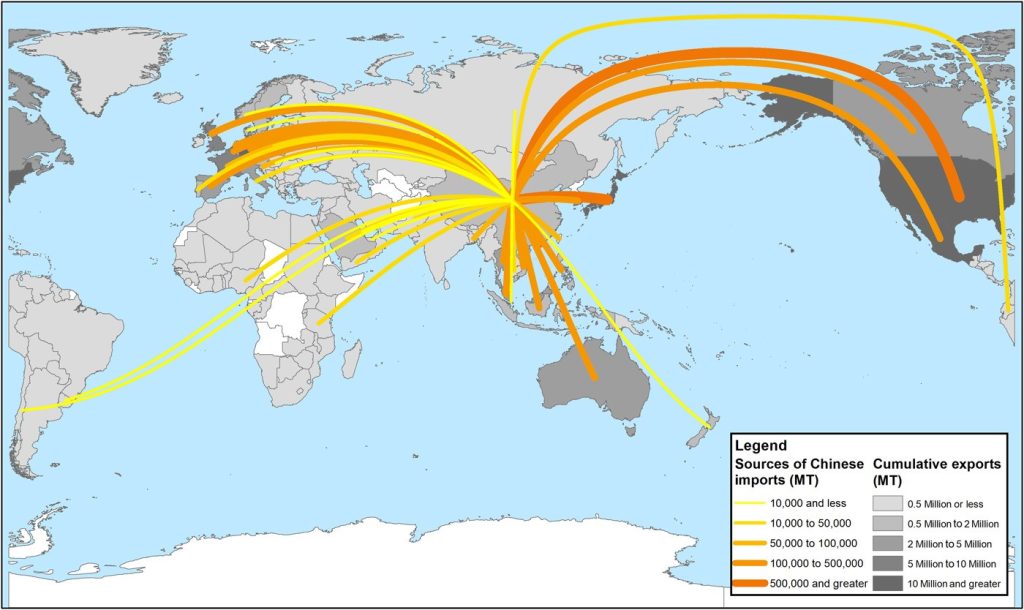
Note: Source: UN Comtrade; Countries with no reported exported plastic waste values are white. Cumulative exports represent by country exports of PE, PS, PVC, and other plastic. Quantities for sources of Chinese imports include PE, PS, PVC, PP, and PET
Management of imported waste in developing countries
Most importing countries lack the infrastructure and capital to adequately manage their own waste let alone that which is imported. This is evidenced by the proportion of waste deposited in open dumps in lower-middle and low income countries (see charts 2 and 3). As a result, imported waste further overburdens landfills or open dumps and worst of all ends up in the oceans.
China implemented the “Green Fence” regulation from early 2017-18 and took the first concrete step to change the tides of global waste trade by banning most plastic imports. This significantly disrupted the balance of trade and vastly reduced the amount of plastic waste flowing from Europe to Asia. Plastic waste exported from Europe to Asia stood at more than 250,000 tonnes in the beginning of 2015 and dropped to less than 150,000 tonnes by early to mid 2018. This is despite countries in South East Asia attempting to pick up the slack left behind by China’s ban.
For instance, from January to October 2018, Germany exported 114,000 tons of plastic rubbish to Malaysia, an increase of 125%.
Chart 4 – Extra-EU-28 plastic waste trade by receiving country
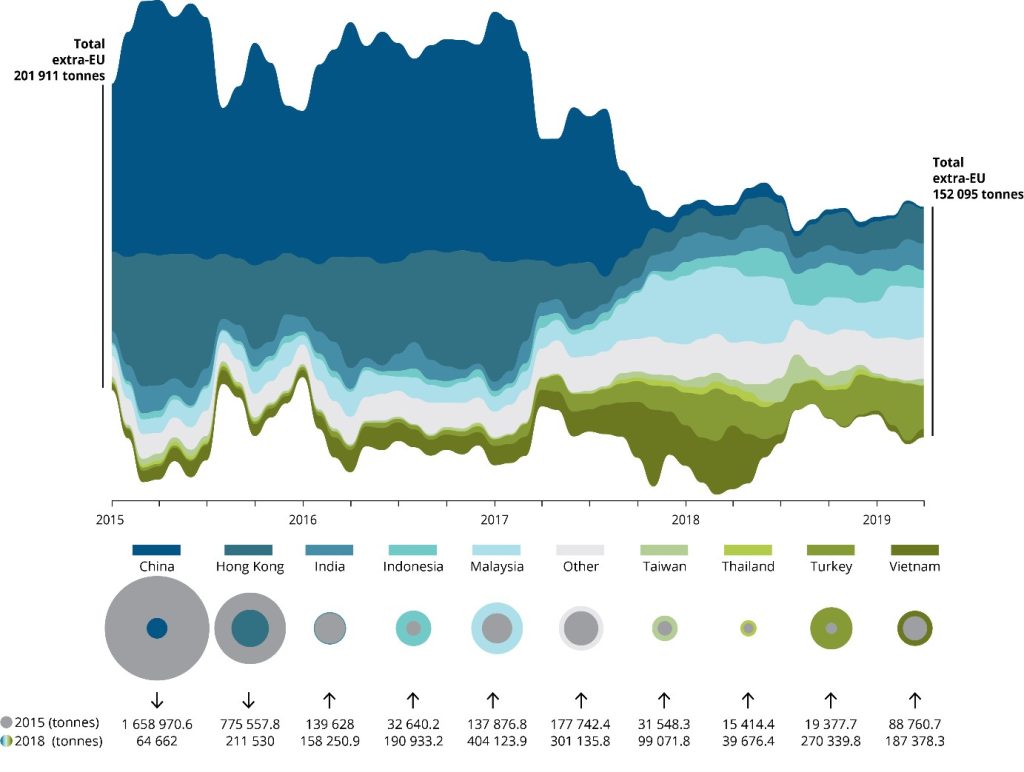
Source: Based on Eurostat data (accessed 9 July 2019); ETC/WMGE 2019; EEA.
Other countries followed China’s example by 2019, though this time seeking the assistance of a UN accord to quell the inflow of waste from developed countries.
This presents a unique opportunity for countries around the world to reimagine their waste management systems and collaborate with each other. Locally, nations will have to restructure their solid waste management systems to deal with un-exported waste, for instance, through the creation of a greater recycling capacity where possible. Asian or other developing nations will have to ramp up their regulatory systems to require sustainable waste management. They will also be forced to improve their infrastructure, among other things to fill the gap left by the ban on imports which may have served as a source of income for some people. Internationally, nations will have to work together to ensure that waste trade is equitable, for instance, by being more stringent in managing the export of harmful materials.
Conclusion
Global waste trade can be equitable to exporting and importing nations, however this will require significant changes to regulation and infrastructure. Developing countries have to put in place more stringent laws on the disposal of waste while building up the right infrastructure to be able to sustainably manage solid waste through recycling and modern waste management practices like planned landfills. Developed nations, as well, have to build up infrastructure at home to manage as much waste as they can and eventually doing away with materials that cannot be safely disposed of or recycled.
Table 1 – Cumulative plastic waste export and import by country (1988–2016, MMT)
Exporters (Top 10)
Rank | Reporter | Economic Classification | Cumulative trade value (US$ billion) | Cumulative net weight (MMT) | Share of Global exports (%) |
1 | Hong Kong, SAR | HIC | 16.7 | 56.1 | 26.1 |
2 | United States | HIC | 12.3 | 26.7 | 12.4 |
3 | Japan | HIC | 9.64 | 22.2 | 10.3 |
4 | Germany | HIC | 6.95 | 17.6 | 8.22 |
5 | Mexico | UMI | 4.55 | 10.5 | 4.9 |
6 | United Kingdom | HIC | 3.32 | 9.26 | 4.31 |
7 | Netherlands | HIC | 3.19 | 7.71 | 3.59 |
8 | France | HIC | 3.49 | 7.55 | 3.52 |
9 | Belgium | HIC | 2.55 | 6.41 | 2.99 |
10 | Canada | HIC | 1.93 | 3.89 | 1.91 |
Total | 64.7 | 168 | 78 |
Importers (Top 10)
Rank | Reporter | Economic Classification | Cumulative trade value (US$ billion) | Cumulative net weight (MMT) | Share of Global exports (%) |
1 | China | UMI | 57.6 | 106 | 45.1 |
2 | Hong Kong, SAR | HIC | 23.3 | 64.5 | 27.3 |
3 | United States | HIC | 5.18 | 8.49 | 3.6 |
4 | Netherlands | HIC | 2.4 | 6.43 | 2.73 |
5 | Germany | HIC | 2.3 | 5.36 | 2.27 |
6 | Belgium | HIC | 1.81 | 4.15 | 1.76 |
7 | Canada | HIC | 1.76 | 3.83 | 1.62 |
8 | Italy | HIC | 1.84 | 3.32 | 1.41 |
9 | India | LMI | 1.2 | 3.1 | 1.31 |
10 | Other Asia | Unspecified | 0.97 | 2.38 | 1.01 |
Total | 98.3 | 208 | 88 |
Note: Source: UN Comtrade; HIC, high-income country; UMI, upper middle income; LMI, lower middle income; LI, low income; based on 2015 gross national income. Cumulative trade value is the sum of reported values based on annual reports by each country for each trade flow from 1988 to 2016 (UN Comtrade Data). Cumulative net weight is the sum of reported values based on annual reports by each country for each trade flow of four categories: waste PE, waste PVC, waste PS, and waste other plastics from 1988 to 2016 (UN Comtrade Data). If considered collectively, then EU-28 countries would rank first on the list of cumulative exports, accounting for 31% of exports. If considered collectively, then the EU-28 would rank third on the list of cumulative imports, accounting for 8.0% of imports
References
Kaza, Silpa, Lisa Yao, Perinaz Bhada-Tata, and Frank Van Woerden. (2018). What a Waste 2.0: A Global Snapshot of Solid Waste Management to 2050. Urban Development Series. Washington, DC: World Bank. doi:10.1596/978-1-4648 -1329-0. License: Creative Commons Attribution CC BY 3.0 IGO
Amy L. Brooks, Shunli Wang and Jenna R. Jambeck. (2018). The Chinese import ban and its impact on global plastic waste trade. Science Advances
Willén, Jenny. (2008). International Trade with Waste – Do developed countries use the third world as a garbage-can or can it be a possible win-win situation?
Online article, no particular author metioned. (2019). The plastic waste trade in the circular economy. European Environmental Agency Briefing. Available at: https://www.eea.europa.eu/themes/waste/resource-efficiency/the-plastic-waste-trade-in [Accessed: 15th November 2020]
Navarro Ferronato, Vincenzo Torretta. (2019). Waste Mismanagement in Developing Countries: A Review of Global Issues. Int J Environ Res Public Health. 2019 Mar; 16(6): 1060. doi: 10.3390/ijerph16061060
WirtschaftsWoche Staff. (2019). How Germany’s recycling ends up in Malaysian dumps. Available at: https://www.handelsblatt.com/english/politics/the-plastic-trail-how-germanys-recycling-ends-up-in-malaysian-dumps-/24037020.html?ticket=ST-13621033-ITdSdF6WS0nze7RgcebU-ap5. [Accessed: 15th November 2020]
Footnotes
[i] For the purposes of this paper landfills are the combinations of sanitary, controlled, unspecified landfills and open dumps
[ii] Here China and Hong Kong, SAR are taken together